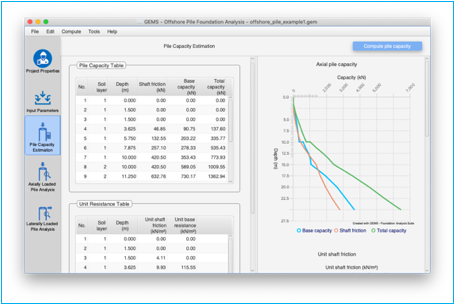
Pile Capacity Estimation
Pile capacity estimation provides the shaft
friction, base capacity and total capacity of the sand layers at varying depths
for the pile.
Compute Pile Capacity
One can also run just the ‘Pile Capacity
Estimation’ by clicking the ‘Compute Pile Capacity’ button on the top righthand
corner of this pane. It will also populate all the graphs and tables below
with the results.
Analysis tables
1.
Pile Capacity Table
2.
Unit Resistance Table
Analysis graphs
1.
Axial Pile Capacity
Diagram
2.
Unit Shaft Friction Diagram
3.
Unit Base Resistance
Diagram
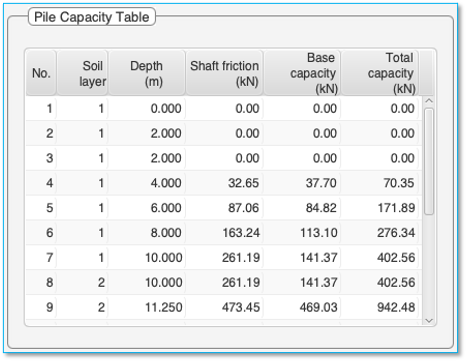
Pile Capacity Table
The pile capacity table tabulates the pile
capacity estimation at various depths and soil layers. The table breaks down
the total pile capacity into its two contributing factors viz. shaft friction
and base capacity.
Note:
One can specify the “Pile capacity depth interval” via Menu
-> File -> Preferences.
Interpolated Pile Capacity
Calculates and displays
the pile capacity at a specified depth by linear interpolation of neighbouring values
from the pile capacity table. The ‘Depth’ value can vary between 0 and the
maximum depth in the pile capacity table (Also the depth to which soil
properties are specified).
Note: The pile capacity needs to be computed before this can be
used.
If two values of pile
capacity are present in the pile capacity table for a particular depth, the
value of the deeper soil layer will be used.
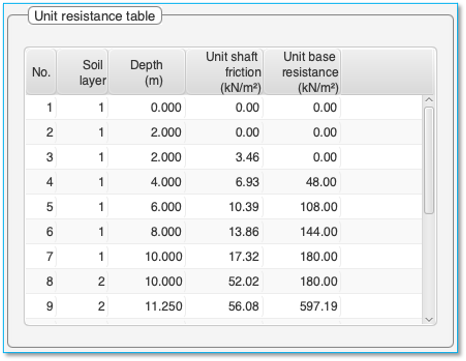
Unit Resistance Table
The ‘Unit Resistance Table’ contains the unit
shaft friction & unit base resistance experienced by the pile at various
depths and soil layers.
Analysis graphs plots the contents of the
analysis tables. The contents of the graph can be copied by right clicking on
the graph and selecting ‘copy’ from the context menu. For cloud version, the
graph can be saved as a 'PNG' image by right clicking on the graph and
selecting ‘save' from the context menu.
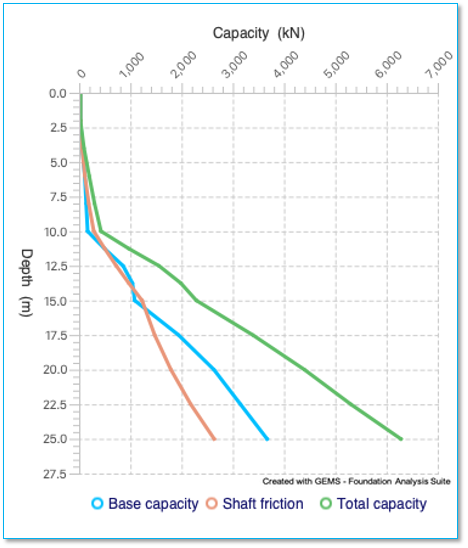
Axial Pile Capacity Diagram
Axial pile capacity diagram plots three
graphs (a) Shaft friction, (b) Base capacity and (c) Total capacity of the pile
vs depth.
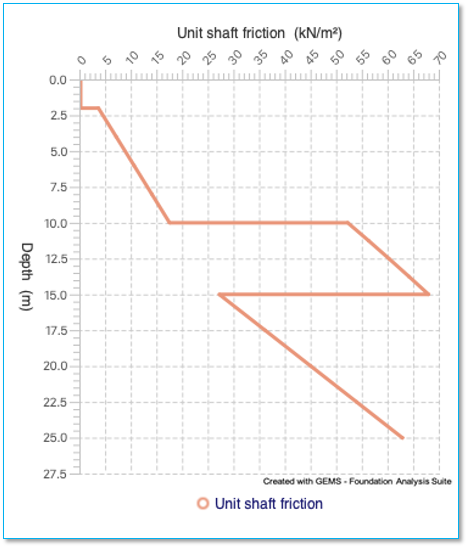
Unit Shaft Friction Diagram
Unit shaft friction diagram plots ‘unit
shaft friction’ vs ‘depth’. The graph plots the ‘unit shaft friction’ column
of the ‘Unit Resistance
Table’ vs ‘depth’ column.
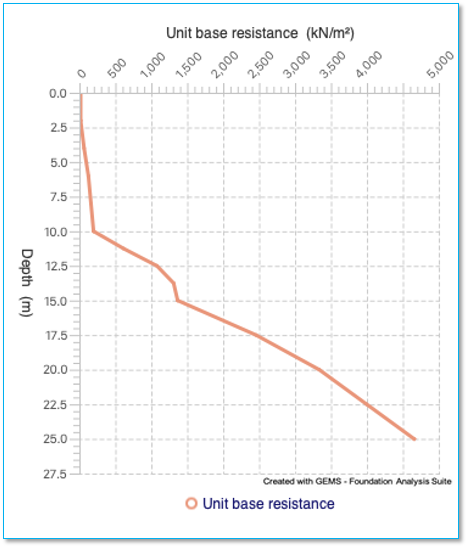
Unit Base Resistance Diagram
Unit base resistance diagram plots the
‘unit base resistance’ of the soil at various depths. The graph plots the
‘unit base resistance’ column of the ‘Unit Resistance Table’ vs ‘depth’
column.
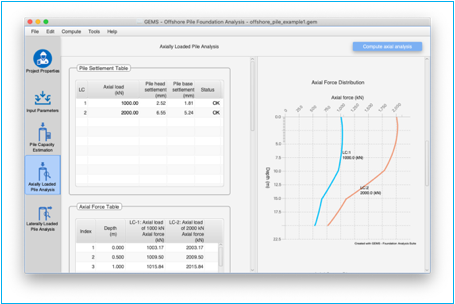
Axial Loaded Pile
Analysis
Axial loaded analysis pane contains the
results of the axial load-case analysis for all the loading scenarios.
Compute Axial Analysis
One can also run just the ‘Axial Loaded Pile
Analysis’ for all the load-cases by clicking the ‘Compute Axial Analysis’
button. This will also generate the ‘t-z’ and ‘Q-z’ tables if the ‘Auto-generate’
option is selected for the ‘t-z’ or ‘Q-z’ curves. It will also populate all
the graphs and tables below with the results.
The analysis pane consists of four tables
and five graphs
Axial analysis tables
1.
Pile Settlement
Table
2.
Axial Force Table
3. Axial Stress Table
4.
Axial Settlement
Table
Axial analysis diagrams
1. Pile Head Settlement Diagram
2. Pile Base Settlement Diagram
3.
Axial Force
Distribution
4.
Axial Stress Diagram
5.
Axial Settlement Diagram
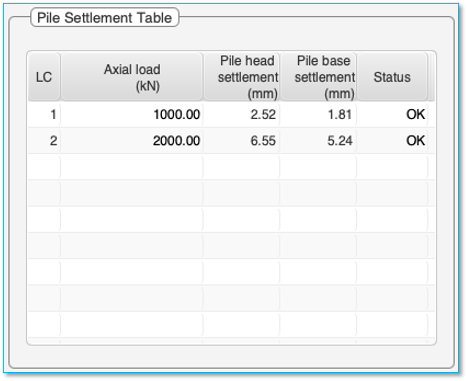
Pile Settlement Table
The Pile Settlement Table details the ‘Pile
head settlement’, ‘Pile base settlement’ and ‘Status’ of the execution for each
of the load cases along with the ‘Axial head load’ applied or ‘Load case
description’.
Status
OK: indicates the analysis completed properly without errors
FAILED: The analysis failed to converge. Most likely the pile has
‘failed’ and the pile may not be able to support the axial load.
ERROR: There was an error in carrying out the analysis. Please check the
values of all the input parameters.
VALIDATION
ERROR: There may be errors in input which can cause
this. This is typically caused when there are axial loads specified at more
than 20 depths across load-cases.
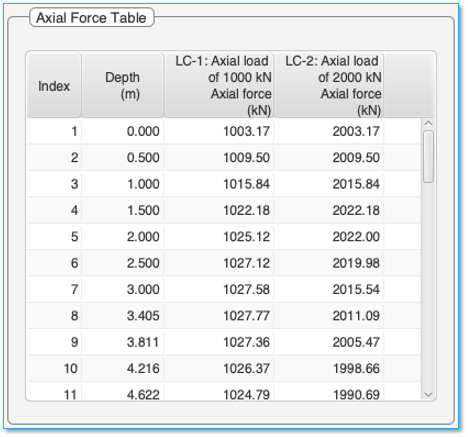
Axial Force Table
The ‘Axial Force Table’ contains the axial
force experienced by the pile at various depths for each of the load case. Each
column in this table represents a separate load-case.
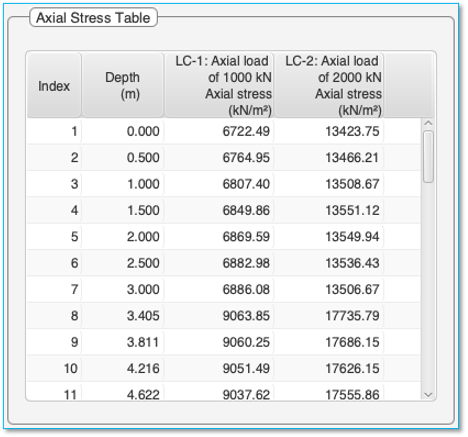
Axial Stress Table
The ‘Axial Stress Table’ contains the Axial
stresses experienced by the pile at various depths. Each column in this table
represents a separate load-case.
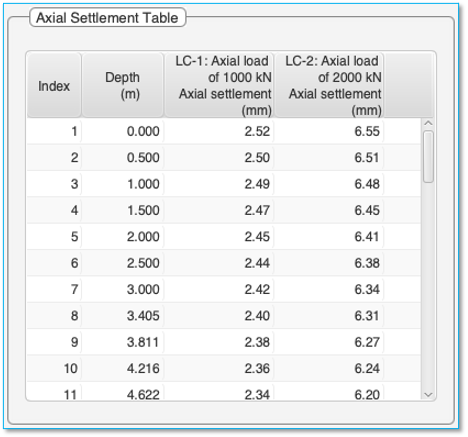
Axial Settlement
Table
The ‘Axial Settlement Table’ contains the
pile settlement at various depths. Each column in this table represents a
separate load-case. The first row represents the pile head settlement while
the last row represents the Pile base settlement.
Axial pile analysis diagrams plot the
contents of the analysis tables. The contents of the graph can be copied by
right clicking on the graph and selecting ‘copy’ from the context menu. For
cloud version, the graph can be saved as a 'PNG' image by right clicking on the
graph and selecting ‘save' from the context menu.
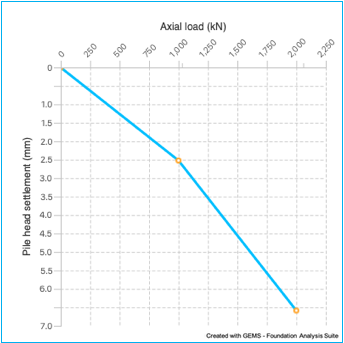
Pile Head Settlement Diagram
‘Pile Head Settlement Diagram’ plots the
vertical settlement of the of the pile head for each of the loads applied.
If axial load at the pile head is only
specified, the pile head settlement is plotted against the axial head load.
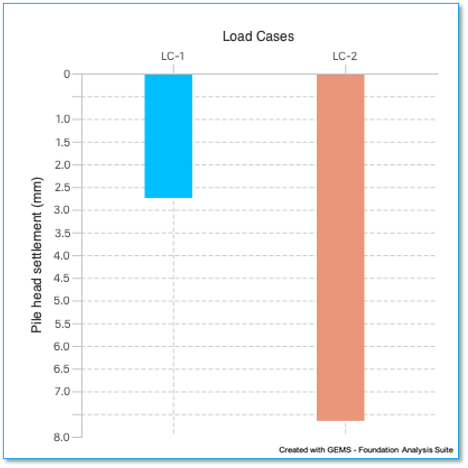
If additional
axial loads along the length of the pile are specified for any of the
load-cases, then the pile head settlement is plotted against each load-case as
a column chart.
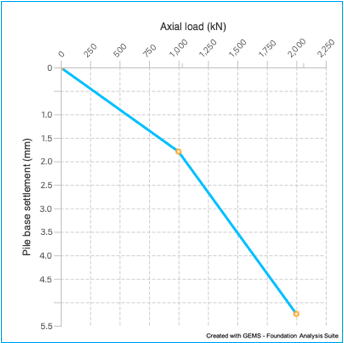
Pile Base Settlement
Diagram
‘Pile Base Settlement Diagram’ plots the
vertical settlement of the of the pile base for each of the loads applied.
If axial load at the pile head is only
specified, the pile base settlement is plotted against the axial head load.
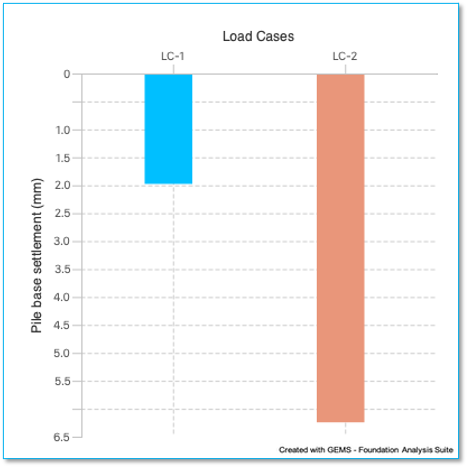
If
additional axial loads along the length of the pile are specified for any
load-case, then the pile base settlement is plotted against each load-case as a
column chart.
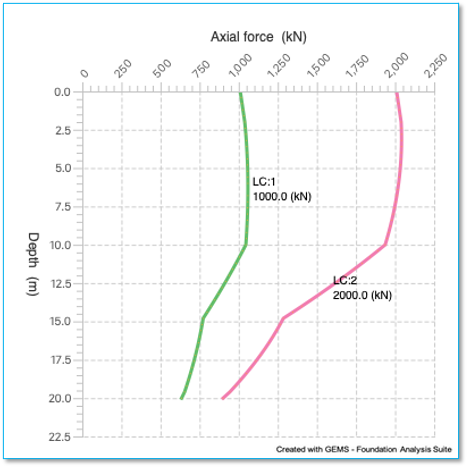
Axial Force Diagram
‘Axial Force Diagram’ plots the axial
forces experienced by the pile along its length for various loads. Each curve
represents a load-case indicated by ‘LC’. Each curve represents an ‘Axial
Force’ column of the ‘Axial
Force Table’ plotted against the ‘depth’ column.
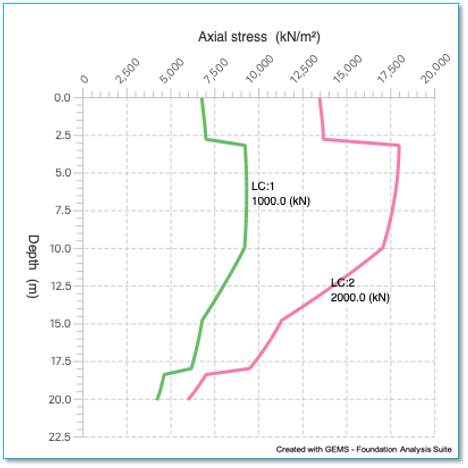
Axial Stress Diagram
‘Axial Stress Diagram’ plots the axial
stress experienced by the pile along its length for various loads. Each curve
represents a load-case indicated by ‘LC’. Each curve represents an ‘Axial
Stress’ column of the ‘Axial
Stress Table’ plotted against the ‘depth’ column.
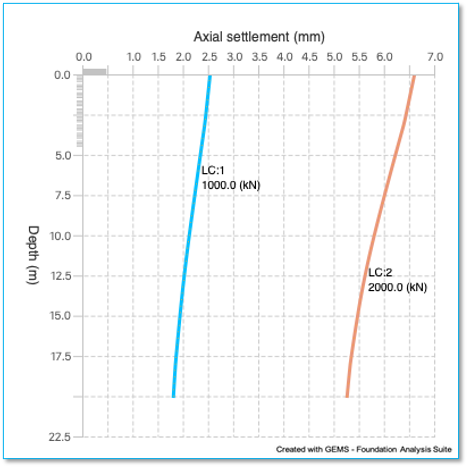
Axial Settlement Diagram
‘Axial Settlement Diagram’ plots the axial settlement
of the pile along its length for various loads. Each curve represents a
load-case indicated by ‘LC’. Each curve represents an ‘Axial Settlement’
column of the ‘Axial
Settlement Table’ plotted against the ‘depth’
column.
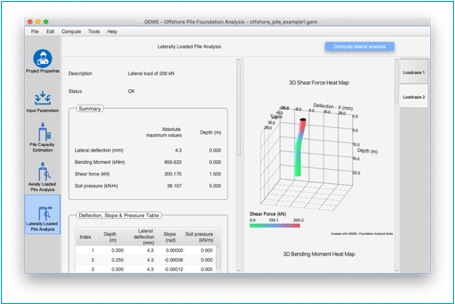
Laterally Loaded Analysis
Laterally loaded analysis pane displays the
results of the laterally loaded pile analysis. Laterally loaded analysis pane
consists of multiple load case tabs displaying the analysis for the
corresponding load cases.
Compute Lateral Analysis
One can also run just the ‘Laterally loaded
pile analysis’ for all the load-cases by clicking the ‘Compute lateral analysis’
button. This will also generate the ‘p-y’ tables if the ‘Auto-generate’ option is selected for the ‘p-y’
curves. It will also populate all the graphs and tables below with the
results.
Each load case analysis tab consists of
three tables and four graphs
Lateral analysis tables
1.
Summary
2.
Deflection,
Slope & Pressure Table
3.
Shear Force
& Bending Moment Table
Lateral analysis diagrams
1.
3D Shear Force Heat
Map
2.
3D Bending Moment
Heat Map
3.
Lateral
Deflection Diagram
4.
Shear Force
Diagram
5.
Bending
Moment Diagram
6.
Soil Pressure
Diagram
Each load case analysis tab consists of
tables tabulating the analysis results for the load case.
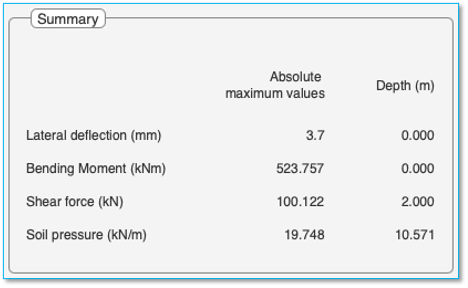
Summary Table
The summary table tabulates the absolute
maximum values of ‘lateral deflection’, ‘bending moment’, ‘shear force’ and
‘soil pressure’ and the depths at which they occur.
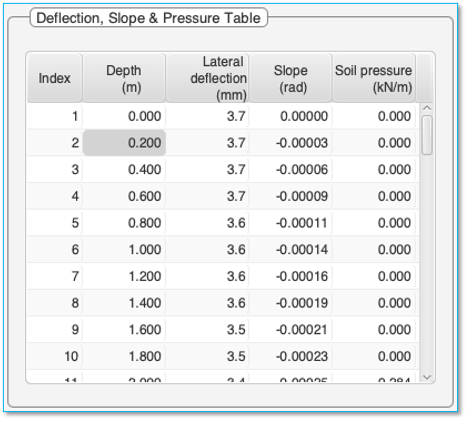
Deflection, Slope
& Pressure Table
The Deflection, slope & pressure table
contains the lateral deflection, slope and soil pressure experienced by the
pile at various depths. Each point represents a node in the finite element
analysis. Deflection towards right is considered positive.
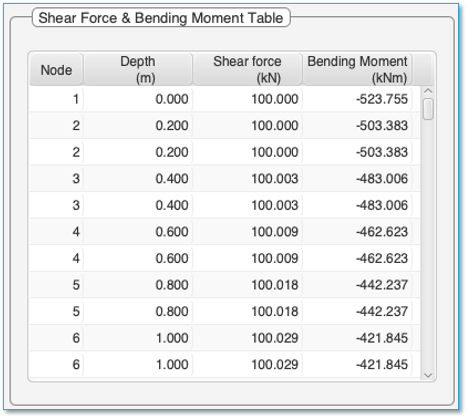
Shear, Bending Moment Table
The Shear, bending moment table contains
the Shear forces & Bending moment experienced by the pile at various
depths. Each point represents a node in the finite element analysis.
Lateral pile analysis diagrams plot the
contents of the analysis tables. The contents of the graph can be copied by
right clicking on the graph and selecting ‘copy’ from the context menu. For
cloud version, the graph can be saved as a 'PNG' image by right clicking on the
graph and selecting ‘save' from the context menu.
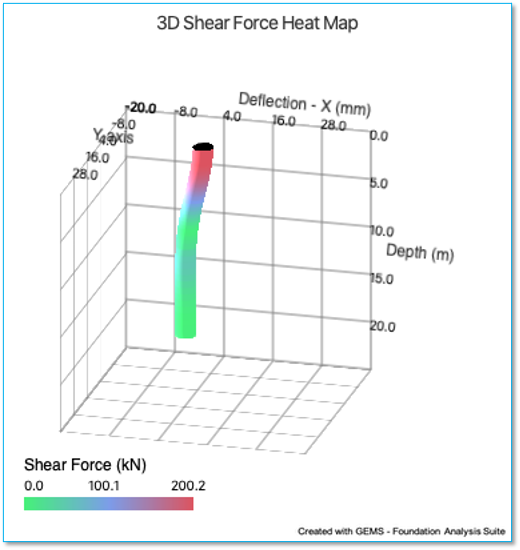
3D Shear Force Heat Map
‘3D Shear Force Heat Map’ overlays the
shear forces along the length of the pile on top of the 3D pile deflection
diagram.
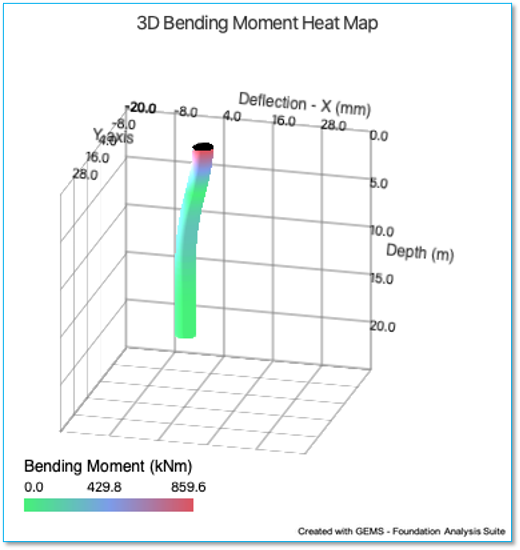
3D Bending Moment Heat Map
‘3D Bending Moment Heat Map’ overlays the
bending moment experienced by the pile at various depths on top of the 3D pile
deflection diagram.
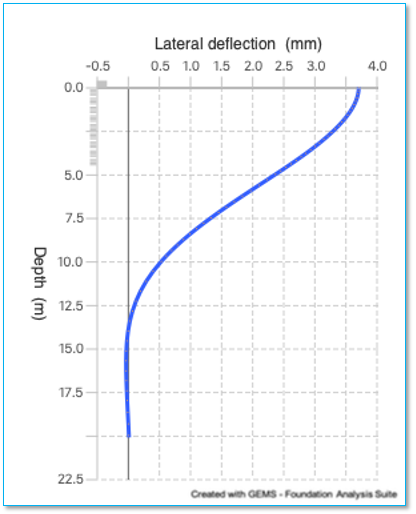
Lateral Deflection Diagram
‘Lateral Deflection Diagram’ plots the
horizontal deflection of the pile at various depths. The graph plots the
‘lateral deflection’ column of the ‘Deflection, slope & pressure table’
vs ‘depth’ column.
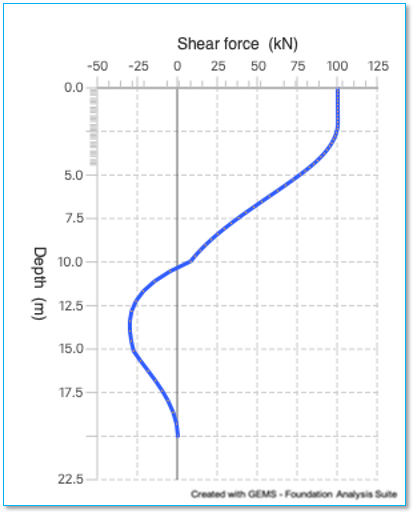
Shear Force Diagram
‘Shear Force Diagram’ plots the shear
forces along the length of the pile. The graph plots the ‘shear force’ column
of the ‘Shear force
and bending moment’ table vs ‘depth’ column.
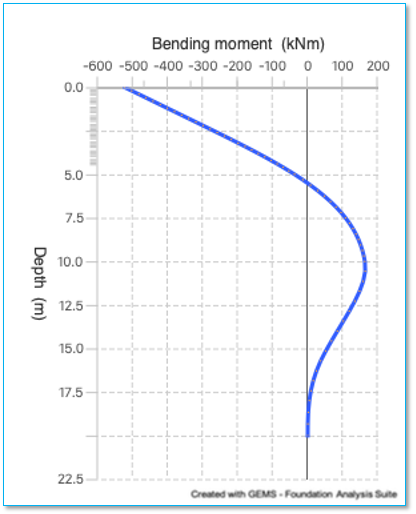
Bending Moment Diagram
‘Bending Moment Graph’ plots the bending
moment experienced by the pile at various depths. The graph plots the ‘Bending
moment’ column of the ‘Shear
Forces and Bending Moment’ table vs ‘depth’
column.
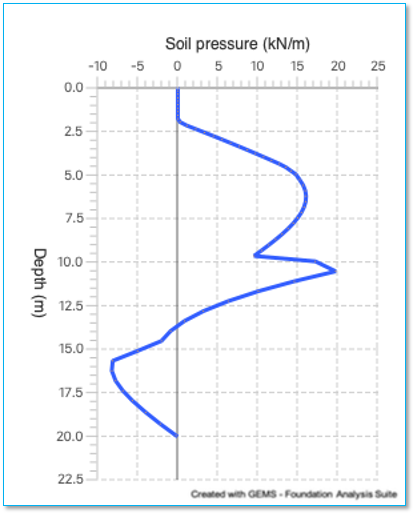
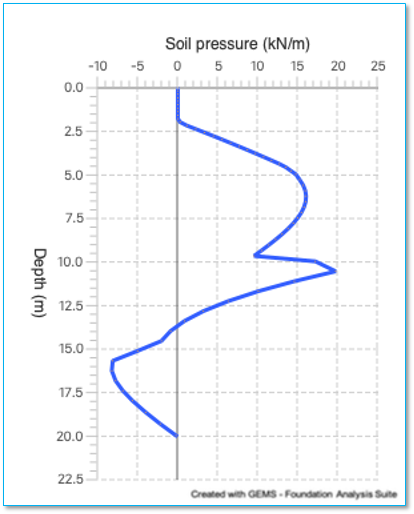
Soil Pressure Diagram
‘Soil Pressure Diagram’ plots the soil
pressure along the length of the pile. The diagram plots the ‘Soil pressure’
column of the ‘Deflection,
Slope & Pressure’ table vs ‘depth’ column.